Twilight Masquerade Sealed Product Price Forecast
Current value, projected return, and one clear action for every sealed product tracked on this page.
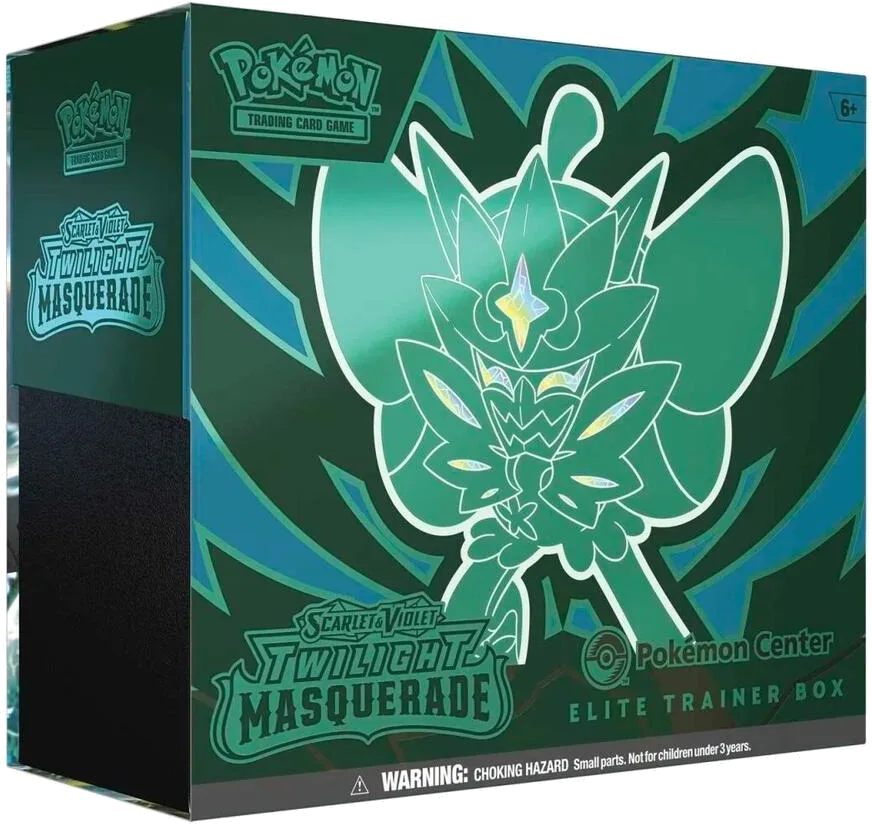
Twilight Masquerade sealed product prices
This page tracks Pokémon Center ETB, Standard ETB, Booster Bundle, Booster Box using separate historical sold-price models. Current modeled values: Pokémon Center ETB: $185.51; Standard ETB: $107.1; Booster Bundle: $76.47; Booster Box: $336.43.
Pokémon Center ETB forecast
What supports this estimate?
5 previous sets · Pokémon Center ETB · ages 28.6–40.6 months.
5 of 5 sets rose over this interval. These are the complete historical paths used by this forecast.
| Historical set | At 28.6 months | At 40.6 months | Gross return | Share of average |
|---|---|---|---|---|
Brilliant Stars ↗Recorded weeksCatalog release: Feb 25, 2022. Start: Jul 15, 2024: $52.54. recorded week. End: Jul 14, 2025: $148.19 · Jul 21, 2025: $147.90. between weekly observations. |
$52.54Jul 15, 2024 | $148.14Jul 15, 2025 | +182.0% | 20.0% |
Celebrations — 25th Anniversary ↗Recorded weeksCatalog release: Oct 8, 2021. Start: Feb 26, 2024: $110.04. recorded week. End: Feb 24, 2025: $188.03 · Mar 3, 2025: $203.81. between weekly observations. |
$110.04Feb 26, 2024 | $190.76Feb 25, 2025 | +73.4% | 20.0% |
Crown Zenith ↗Recorded weeksCatalog release: Jan 20, 2023. Start: Jun 9, 2025: $280.78. recorded week. End: Jun 8, 2026: $580.70 · Jun 15, 2026: $586.15. between weekly observations. |
$280.78Jun 9, 2025 | $581.67Jun 9, 2026 | +107.2% | 20.0% |
Fusion Strike ↗Recorded weeksCatalog release: Nov 12, 2021. Start: Apr 1, 2024: $60.86. recorded week. End: Mar 31, 2025: $197.79 · Apr 7, 2025: $195.19. between weekly observations. |
$60.86Apr 1, 2024 | $197.32Apr 1, 2025 | +224.2% | 20.0% |
Lost Origin ↗Recorded weeksCatalog release: Sep 9, 2022. Start: Jan 27, 2025: $119.37. recorded week. End: Jan 26, 2026: $249.04 · Feb 2, 2026: $242.04. between weekly observations. |
$119.37Jan 27, 2025 | $247.78Jan 27, 2026 | +107.6% | 20.0% |
$185.51 × 2.3885 = $443.09. After 15% selling costs: +103.0% net ROI.
We average each set’s percentage change over this interval, then apply that average to today’s price. Each physical set has equal influence; variants are averaged within their set first. Unusually large gains or losses can move this simple average substantially.
Source: TCGplayer weekly market-price history. Ages use catalog release dates, which may be set launch dates. Between-week prices are log-interpolated; open “Recorded weeks” to inspect the observations. Prices are rounded for display. Comparison periods may overlap and share market conditions. Historical returns do not guarantee this product’s outcome.
Historical comparisons for other supported horizons
What supports this estimate?
5 previous sets · Pokémon Center ETB · ages 28.6–34.6 months.
4 of 5 sets rose over this interval; 1 fell. These are the complete historical paths used by this forecast.
| Historical set | At 28.6 months | At 34.6 months | Gross return | Share of average |
|---|---|---|---|---|
Brilliant Stars ↗Recorded weeksCatalog release: Feb 25, 2022. Start: Jul 15, 2024: $52.54. recorded week. End: Jan 13, 2025: $73.41 · Jan 20, 2025: $81.33. between weekly observations. |
$52.54Jul 15, 2024 | $74.08Jan 13, 2025 | +41.0% | 20.0% |
Celebrations — 25th Anniversary ↗Recorded weeksCatalog release: Oct 8, 2021. Start: Feb 26, 2024: $110.04. recorded week. End: Aug 26, 2024: $102.65 · Sep 2, 2024: $103.95. between weekly observations. |
$110.04Feb 26, 2024 | $102.77Aug 26, 2024 | -6.6% | 20.0% |
Crown Zenith ↗Recorded weeksCatalog release: Jan 20, 2023. Start: Jun 9, 2025: $280.78. recorded week. End: Dec 8, 2025: $426.86 · Dec 15, 2025: $415.54. between weekly observations. |
$280.78Jun 9, 2025 | $425.84Dec 8, 2025 | +51.7% | 20.0% |
Fusion Strike ↗Recorded weeksCatalog release: Nov 12, 2021. Start: Apr 1, 2024: $60.86. recorded week. End: Sep 30, 2024: $73.72 · Oct 7, 2024: $73.52. between weekly observations. |
$60.86Apr 1, 2024 | $73.70Sep 30, 2024 | +21.1% | 20.0% |
Lost Origin ↗Recorded weeksCatalog release: Sep 9, 2022. Start: Jan 27, 2025: $119.37. recorded week. End: Jul 28, 2025: $214.82 · Aug 4, 2025: $215.62. between weekly observations. |
$119.37Jan 27, 2025 | $214.89Jul 28, 2025 | +80.0% | 20.0% |
$185.51 × 1.3744 = $254.96. After 15% selling costs: +16.8% net ROI.
We average each set’s percentage change over this interval, then apply that average to today’s price. Each physical set has equal influence; variants are averaged within their set first. Unusually large gains or losses can move this simple average substantially.
Source: TCGplayer weekly market-price history. Ages use catalog release dates, which may be set launch dates. Between-week prices are log-interpolated; open “Recorded weeks” to inspect the observations. Prices are rounded for display. Comparison periods may overlap and share market conditions. Historical returns do not guarantee this product’s outcome.
What supports this estimate?
5 previous sets · Pokémon Center ETB · ages 28.6–44.6 months.
5 of 5 sets rose over this interval. These are the complete historical paths used by this forecast.
| Historical set | At 28.6 months | At 44.6 months | Gross return | Share of average |
|---|---|---|---|---|
Brilliant Stars ↗Recorded weeksCatalog release: Feb 25, 2022. Start: Jul 15, 2024: $52.54. recorded week. End: Nov 10, 2025: $183.36 · Nov 17, 2025: $182.31. between weekly observations. |
$52.54Jul 15, 2024 | $182.76Nov 14, 2025 | +247.8% | 20.0% |
Celebrations — 25th Anniversary ↗Recorded weeksCatalog release: Oct 8, 2021. Start: Feb 26, 2024: $110.04. recorded week. End: Jun 23, 2025: $232.52 · Jun 30, 2025: $248.44. between weekly observations. |
$110.04Feb 26, 2024 | $241.49Jun 27, 2025 | +119.5% | 20.0% |
Crown Zenith ↗Recorded weeksCatalog release: Jan 20, 2023. Start: Jun 9, 2025: $280.78. recorded week. End: Oct 5, 2026: $530.86 · Oct 12, 2026: $532.66. between weekly observations. |
$280.78Jun 9, 2025 | $531.89Oct 9, 2026 | +89.4% | 20.0% |
Fusion Strike ↗Recorded weeksCatalog release: Nov 12, 2021. Start: Apr 1, 2024: $60.86. recorded week. End: Jul 28, 2025: $358.40 · Aug 4, 2025: $350.67. between weekly observations. |
$60.86Apr 1, 2024 | $353.96Aug 1, 2025 | +481.6% | 20.0% |
Lost Origin ↗Recorded weeksCatalog release: Sep 9, 2022. Start: Jan 27, 2025: $119.37. recorded week. End: May 25, 2026: $354.24 · Jun 8, 2026: $358.40. between weekly observations. |
$119.37Jan 27, 2025 | $355.42May 29, 2026 | +197.7% | 20.0% |
$185.51 × 3.2722 = $607.02. After 15% selling costs: +178.1% net ROI.
We average each set’s percentage change over this interval, then apply that average to today’s price. Each physical set has equal influence; variants are averaged within their set first. Unusually large gains or losses can move this simple average substantially.
Source: TCGplayer weekly market-price history. Ages use catalog release dates, which may be set launch dates. Between-week prices are log-interpolated; open “Recorded weeks” to inspect the observations. Prices are rounded for display. Comparison periods may overlap and share market conditions. Historical returns do not guarantee this product’s outcome.
Historical support ends 16 months ahead. No extrapolation.
24-month estimate unavailable: insufficient complete historical paths.
36-month estimate unavailable: insufficient complete historical paths.
Only Pokémon Center ETB histories contribute; collections match their specific format. At least five distinct physical sets must have recorded the entire forecast interval from the same lifecycle age. Up to 20 recent eligible sets contribute, with variants sharing a set’s influence. The longest supported cohort stays fixed across the chart. The center is the simple arithmetic average of recorded cumulative percentage returns. Each physical set has equal influence; variants are averaged within their set first. Every displayed return stays within the observed peer minimum and maximum at that horizon. No mature trend, borrowed age, or short-run annualization extends the curve. Historical support ends 16 months ahead; later targets are unavailable. Equal-set 10–90% historical ranges include the average and are not calibrated probability intervals.
Standard ETB forecast
What supports this estimate?
5 previous sets · Standard ETB · ages 28.6–40.6 months.
5 of 5 sets rose over this interval. These are the complete historical paths used by this forecast.
| Historical set | At 28.6 months | At 40.6 months | Gross return | Share of average |
|---|---|---|---|---|
Brilliant Stars ↗Recorded weeksCatalog release: Feb 25, 2022. Start: Jul 15, 2024: $40.03. recorded week. End: Jul 14, 2025: $91.82 · Jul 21, 2025: $91.99. between weekly observations. |
$40.03Jul 15, 2024 | $91.85Jul 15, 2025 | +129.5% | 20.0% |
Celebrations — 25th Anniversary ↗Recorded weeksCatalog release: Oct 8, 2021. Start: Feb 26, 2024: $78.51. recorded week. End: Feb 24, 2025: $121.76 · Mar 3, 2025: $125.43. between weekly observations. |
$78.51Feb 26, 2024 | $122.41Feb 25, 2025 | +55.9% | 20.0% |
Chilling Reign — Ice Rider ↗Recorded weeksCatalog release: Jun 18, 2021. Start: Nov 6, 2023: $46.80. recorded week. End: Nov 4, 2024: $46.99 · Nov 11, 2024: $46.84. between weekly observations. |
$46.80Nov 6, 2023 | $46.96Nov 5, 2024 | +0.3% | 20.0% |
Evolving Skies — Eeveelutions 1 ↗Recorded weeksCatalog release: Aug 27, 2021. Start: Jan 15, 2024: $98.76. recorded week. End: Jan 13, 2025: $218.36 · Jan 20, 2025: $224.72. between weekly observations. |
$98.76Jan 15, 2024 | $219.48Jan 14, 2025 | +122.2% | 10.0% |
Evolving Skies — Eeveelutions 2 ↗Recorded weeksCatalog release: Aug 27, 2021. Start: Jan 15, 2024: $121.45. recorded week. End: Jan 13, 2025: $223.88 · Jan 20, 2025: $227.93. between weekly observations. |
$121.45Jan 15, 2024 | $224.60Jan 14, 2025 | +84.9% | 10.0% |
Fusion Strike ↗Recorded weeksCatalog release: Nov 12, 2021. Start: Apr 1, 2024: $42.30. recorded week. End: Mar 31, 2025: $130.05 · Apr 7, 2025: $138.21. between weekly observations. |
$42.30Apr 1, 2024 | $131.47Apr 1, 2025 | +210.8% | 20.0% |
$107.10 × 2.0002 = $214.22. After 15% selling costs: +70.0% net ROI.
We average each set’s percentage change over this interval, then apply that average to today’s price. Each physical set has equal influence; variants are averaged within their set first. Unusually large gains or losses can move this simple average substantially.
Source: TCGplayer weekly market-price history. Ages use catalog release dates, which may be set launch dates. Between-week prices are log-interpolated; open “Recorded weeks” to inspect the observations. Prices are rounded for display. Comparison periods may overlap and share market conditions. Historical returns do not guarantee this product’s outcome.
Historical comparisons for other supported horizons
What supports this estimate?
5 previous sets · Standard ETB · ages 28.6–34.6 months.
4 of 5 sets rose over this interval; 1 fell. These are the complete historical paths used by this forecast.
| Historical set | At 28.6 months | At 34.6 months | Gross return | Share of average |
|---|---|---|---|---|
Brilliant Stars ↗Recorded weeksCatalog release: Feb 25, 2022. Start: Jul 15, 2024: $40.03. recorded week. End: Jan 13, 2025: $57.47 · Jan 20, 2025: $62.65. between weekly observations. |
$40.03Jul 15, 2024 | $57.91Jan 13, 2025 | +44.7% | 20.0% |
Celebrations — 25th Anniversary ↗Recorded weeksCatalog release: Oct 8, 2021. Start: Feb 26, 2024: $78.51. recorded week. End: Aug 26, 2024: $79.55 · Sep 2, 2024: $80.61. between weekly observations. |
$78.51Feb 26, 2024 | $79.64Aug 26, 2024 | +1.4% | 20.0% |
Chilling Reign — Ice Rider ↗Recorded weeksCatalog release: Jun 18, 2021. Start: Nov 6, 2023: $46.80. recorded week. End: May 6, 2024: $43.93 · May 13, 2024: $44.64. between weekly observations. |
$46.80Nov 6, 2023 | $43.99May 6, 2024 | -6.0% | 20.0% |
Evolving Skies — Eeveelutions 1 ↗Recorded weeksCatalog release: Aug 27, 2021. Start: Jan 15, 2024: $98.76. recorded week. End: Jul 15, 2024: $124.67 · Jul 22, 2024: $125.36. between weekly observations. |
$98.76Jan 15, 2024 | $124.73Jul 15, 2024 | +26.3% | 10.0% |
Evolving Skies — Eeveelutions 2 ↗Recorded weeksCatalog release: Aug 27, 2021. Start: Jan 15, 2024: $121.45. recorded week. End: Jul 15, 2024: $135.97 · Jul 22, 2024: $133.86. between weekly observations. |
$121.45Jan 15, 2024 | $135.78Jul 15, 2024 | +11.8% | 10.0% |
Fusion Strike ↗Recorded weeksCatalog release: Nov 12, 2021. Start: Apr 1, 2024: $42.30. recorded week. End: Sep 30, 2024: $55.89 · Oct 7, 2024: $56.13. between weekly observations. |
$42.30Apr 1, 2024 | $55.91Sep 30, 2024 | +32.2% | 20.0% |
$107.10 × 1.1827 = $126.67. After 15% selling costs: +0.5% net ROI.
We average each set’s percentage change over this interval, then apply that average to today’s price. Each physical set has equal influence; variants are averaged within their set first. Unusually large gains or losses can move this simple average substantially.
Source: TCGplayer weekly market-price history. Ages use catalog release dates, which may be set launch dates. Between-week prices are log-interpolated; open “Recorded weeks” to inspect the observations. Prices are rounded for display. Comparison periods may overlap and share market conditions. Historical returns do not guarantee this product’s outcome.
What supports this estimate?
5 previous sets · Standard ETB · ages 28.6–52.6 months.
5 of 5 sets rose over this interval. These are the complete historical paths used by this forecast.
| Historical set | At 28.6 months | At 52.6 months | Gross return | Share of average |
|---|---|---|---|---|
Brilliant Stars ↗Recorded weeksCatalog release: Feb 25, 2022. Start: Jul 15, 2024: $40.03. recorded week. End: Jul 13, 2026: $171.96 · Jul 20, 2026: $174.08. between weekly observations. |
$40.03Jul 15, 2024 | $172.71Jul 15, 2026 | +331.5% | 20.0% |
Celebrations — 25th Anniversary ↗Recorded weeksCatalog release: Oct 8, 2021. Start: Feb 26, 2024: $78.51. recorded week. End: Feb 23, 2026: $310.46 · Mar 2, 2026: $306.94. between weekly observations. |
$78.51Feb 26, 2024 | $309.20Feb 25, 2026 | +293.8% | 20.0% |
Chilling Reign — Ice Rider ↗Recorded weeksCatalog release: Jun 18, 2021. Start: Nov 6, 2023: $46.80. recorded week. End: Nov 3, 2025: $102.44 · Nov 10, 2025: $103.23. between weekly observations. |
$46.80Nov 6, 2023 | $102.72Nov 5, 2025 | +119.5% | 20.0% |
Evolving Skies — Eeveelutions 1 ↗Recorded weeksCatalog release: Aug 27, 2021. Start: Jan 15, 2024: $98.76. recorded week. End: Jan 12, 2026: $357.49 · Jan 19, 2026: $369.00. between weekly observations. |
$98.76Jan 15, 2024 | $361.56Jan 14, 2026 | +266.1% | 10.0% |
Evolving Skies — Eeveelutions 2 ↗Recorded weeksCatalog release: Aug 27, 2021. Start: Jan 15, 2024: $121.45. recorded week. End: Jan 12, 2026: $380.07 · Jan 19, 2026: $383.87. between weekly observations. |
$121.45Jan 15, 2024 | $381.42Jan 14, 2026 | +214.1% | 10.0% |
Fusion Strike ↗Recorded weeksCatalog release: Nov 12, 2021. Start: Apr 1, 2024: $42.30. recorded week. End: Mar 30, 2026: $287.43 · Apr 6, 2026: $302.72. between weekly observations. |
$42.30Apr 1, 2024 | $292.80Apr 1, 2026 | +592.2% | 20.0% |
$107.10 × 4.1541 = $444.91. After 15% selling costs: +253.1% net ROI.
We average each set’s percentage change over this interval, then apply that average to today’s price. Each physical set has equal influence; variants are averaged within their set first. Unusually large gains or losses can move this simple average substantially.
Source: TCGplayer weekly market-price history. Ages use catalog release dates, which may be set launch dates. Between-week prices are log-interpolated; open “Recorded weeks” to inspect the observations. Prices are rounded for display. Comparison periods may overlap and share market conditions. Historical returns do not guarantee this product’s outcome.
What supports this estimate?
5 previous sets · Standard ETB · ages 28.6–55.1 months.
5 of 5 sets rose over this interval. These are the complete historical paths used by this forecast.
| Historical set | At 28.6 months | At 55.1 months | Gross return | Share of average |
|---|---|---|---|---|
Brilliant Stars ↗Recorded weeksCatalog release: Feb 25, 2022. Start: Jul 15, 2024: $40.03. recorded week. End: Sep 28, 2026: $158.87 · Oct 5, 2026: $163.82. between weekly observations. |
$40.03Jul 15, 2024 | $159.98Sep 29, 2026 | +299.7% | 20.0% |
Celebrations — 25th Anniversary ↗Recorded weeksCatalog release: Oct 8, 2021. Start: Feb 26, 2024: $78.51. recorded week. End: May 11, 2026: $388.52 · May 18, 2026: $384.96. between weekly observations. |
$78.51Feb 26, 2024 | $387.71May 12, 2026 | +393.8% | 20.0% |
Chilling Reign — Ice Rider ↗Recorded weeksCatalog release: Jun 18, 2021. Start: Nov 6, 2023: $46.80. recorded week. End: Jan 19, 2026: $106.98 · Feb 16, 2026: $108.69. between weekly observations. |
$46.80Nov 6, 2023 | $107.08Jan 20, 2026 | +128.8% | 20.0% |
Evolving Skies — Eeveelutions 1 ↗Recorded weeksCatalog release: Aug 27, 2021. Start: Jan 15, 2024: $98.76. recorded week. End: Mar 30, 2026: $496.23 · Apr 6, 2026: $501.59. between weekly observations. |
$98.76Jan 15, 2024 | $497.45Mar 31, 2026 | +403.7% | 10.0% |
Evolving Skies — Eeveelutions 2 ↗Recorded weeksCatalog release: Aug 27, 2021. Start: Jan 15, 2024: $121.45. recorded week. End: Mar 30, 2026: $505.11 · Apr 6, 2026: $502.46. between weekly observations. |
$121.45Jan 15, 2024 | $504.51Mar 31, 2026 | +315.4% | 10.0% |
Fusion Strike ↗Recorded weeksCatalog release: Nov 12, 2021. Start: Apr 1, 2024: $42.30. recorded week. End: Jun 15, 2026: $360.83 · Jun 22, 2026: $366.40. between weekly observations. |
$42.30Apr 1, 2024 | $362.09Jun 16, 2026 | +756.0% | 20.0% |
$107.10 × 4.8757 = $522.19. After 15% selling costs: +314.4% net ROI.
We average each set’s percentage change over this interval, then apply that average to today’s price. Each physical set has equal influence; variants are averaged within their set first. Unusually large gains or losses can move this simple average substantially.
Source: TCGplayer weekly market-price history. Ages use catalog release dates, which may be set launch dates. Between-week prices are log-interpolated; open “Recorded weeks” to inspect the observations. Prices are rounded for display. Comparison periods may overlap and share market conditions. Historical returns do not guarantee this product’s outcome.
Historical support ends 26.5 months ahead. No extrapolation.
24-month estimate: $444.91 · historical range: $286.73–$629.65
36-month estimate unavailable: insufficient complete historical paths.
Only Standard ETB histories contribute; collections match their specific format. At least five distinct physical sets must have recorded the entire forecast interval from the same lifecycle age. Up to 20 recent eligible sets contribute, with variants sharing a set’s influence. The longest supported cohort stays fixed across the chart. The center is the simple arithmetic average of recorded cumulative percentage returns. Each physical set has equal influence; variants are averaged within their set first. Every displayed return stays within the observed peer minimum and maximum at that horizon. No mature trend, borrowed age, or short-run annualization extends the curve. Historical support ends 26.5 months ahead; later targets are unavailable. Equal-set 10–90% historical ranges include the average and are not calibrated probability intervals.
Booster Bundle forecast
What supports this estimate?
5 previous sets · 6-pack Booster Bundle · ages 28.6–37.6 months.
5 of 5 sets rose over this interval. These are the complete historical paths used by this forecast.
| Historical set | At 28.6 months | At 37.6 months | Gross return | Share of average |
|---|---|---|---|---|
Crown Zenith ↗Recorded weeksCatalog release: Jan 20, 2023. Start: Jun 9, 2025: $83.10. recorded week. End: Mar 9, 2026: $166.75 · Mar 16, 2026: $173.55. between weekly observations. |
$83.10Jun 9, 2025 | $167.65Mar 9, 2026 | +101.7% | 20.0% |
Lost Origin ↗Recorded weeksCatalog release: Sep 9, 2022. Start: Jan 27, 2025: $62.04. recorded week. End: Oct 27, 2025: $121.34 · Nov 17, 2025: $121.86. between weekly observations. |
$62.04Jan 27, 2025 | $121.36Oct 27, 2025 | +95.6% | 20.0% |
Obsidian Flames ↗Recorded weeksCatalog release: Aug 11, 2023. Start: Dec 29, 2025: $61.67. recorded week. End: Sep 28, 2026: $121.73 · Oct 5, 2026: $121.69. between weekly observations. |
$61.67Dec 29, 2025 | $121.72Sep 28, 2026 | +97.4% | 20.0% |
Paldea Evolved ↗Recorded weeksCatalog release: Jun 9, 2023. Start: Oct 27, 2025: $76.67. recorded week. End: Jul 27, 2026: $123.56 · Aug 3, 2026: $123.87. between weekly observations. |
$76.67Oct 27, 2025 | $123.60Jul 27, 2026 | +61.2% | 20.0% |
Silver Tempest ↗Recorded weeksCatalog release: Nov 11, 2022. Start: Mar 31, 2025: $47.16. recorded week. End: Dec 29, 2025: $74.35 · Jan 5, 2026: $74.14. between weekly observations. |
$47.16Mar 31, 2025 | $74.32Dec 29, 2025 | +57.6% | 20.0% |
$76.47 × 1.8271 = $139.72. After 15% selling costs: +55.3% net ROI.
We average each set’s percentage change over this interval, then apply that average to today’s price. Each physical set has equal influence; variants are averaged within their set first. Unusually large gains or losses can move this simple average substantially.
Source: TCGplayer weekly market-price history. Ages use catalog release dates, which may be set launch dates. Between-week prices are log-interpolated; open “Recorded weeks” to inspect the observations. Prices are rounded for display. Comparison periods may overlap and share market conditions. Historical returns do not guarantee this product’s outcome.
Historical comparisons for other supported horizons
What supports this estimate?
5 previous sets · 6-pack Booster Bundle · ages 28.6–34.6 months.
5 of 5 sets rose over this interval. These are the complete historical paths used by this forecast.
| Historical set | At 28.6 months | At 34.6 months | Gross return | Share of average |
|---|---|---|---|---|
Crown Zenith ↗Recorded weeksCatalog release: Jan 20, 2023. Start: Jun 9, 2025: $83.10. recorded week. End: Dec 8, 2025: $109.06 · Dec 15, 2025: $115.16. between weekly observations. |
$83.10Jun 9, 2025 | $109.59Dec 8, 2025 | +31.9% | 20.0% |
Lost Origin ↗Recorded weeksCatalog release: Sep 9, 2022. Start: Jan 27, 2025: $62.04. recorded week. End: Jul 28, 2025: $92.43 · Aug 4, 2025: $94.94. between weekly observations. |
$62.04Jan 27, 2025 | $92.65Jul 28, 2025 | +49.3% | 20.0% |
Obsidian Flames ↗Recorded weeksCatalog release: Aug 11, 2023. Start: Dec 29, 2025: $61.67. recorded week. End: Jun 29, 2026: $115.94 · Jul 6, 2026: $116.30. between weekly observations. |
$61.67Dec 29, 2025 | $115.97Jun 29, 2026 | +88.1% | 20.0% |
Paldea Evolved ↗Recorded weeksCatalog release: Jun 9, 2023. Start: Oct 27, 2025: $76.67. recorded week. End: Apr 27, 2026: $109.27 · May 4, 2026: $114.36. between weekly observations. |
$76.67Oct 27, 2025 | $109.72Apr 27, 2026 | +43.1% | 20.0% |
Silver Tempest ↗Recorded weeksCatalog release: Nov 11, 2022. Start: Mar 31, 2025: $47.16. recorded week. End: Sep 29, 2025: $72.56 · Oct 6, 2025: $73.62. between weekly observations. |
$47.16Mar 31, 2025 | $72.65Sep 29, 2025 | +54.1% | 20.0% |
$76.47 × 1.5329 = $117.22. After 15% selling costs: +30.3% net ROI.
We average each set’s percentage change over this interval, then apply that average to today’s price. Each physical set has equal influence; variants are averaged within their set first. Unusually large gains or losses can move this simple average substantially.
Source: TCGplayer weekly market-price history. Ages use catalog release dates, which may be set launch dates. Between-week prices are log-interpolated; open “Recorded weeks” to inspect the observations. Prices are rounded for display. Comparison periods may overlap and share market conditions. Historical returns do not guarantee this product’s outcome.
Historical support ends 9 months ahead. No extrapolation.
24-month estimate unavailable: insufficient complete historical paths.
36-month estimate unavailable: insufficient complete historical paths.
Only 6-pack Booster Bundle histories contribute; collections match their specific format. At least five distinct physical sets must have recorded the entire forecast interval from the same lifecycle age. Up to 20 recent eligible sets contribute, with variants sharing a set’s influence. The longest supported cohort stays fixed across the chart. The center is the simple arithmetic average of recorded cumulative percentage returns. Each physical set has equal influence; variants are averaged within their set first. Every displayed return stays within the observed peer minimum and maximum at that horizon. No mature trend, borrowed age, or short-run annualization extends the curve. Historical support ends 9 months ahead; later targets are unavailable. Equal-set 10–90% historical ranges include the average and are not calibrated probability intervals.
Booster Box forecast
What supports this estimate?
5 previous sets · 36-pack Booster Box · ages 28.6–40.6 months.
5 of 5 sets rose over this interval. These are the complete historical paths used by this forecast.
| Historical set | At 28.6 months | At 40.6 months | Gross return | Share of average |
|---|---|---|---|---|
Astral Radiance ↗Recorded weeksCatalog release: May 27, 2022. Start: Oct 14, 2024: $170.44. recorded week. End: Sep 29, 2025: $405.54 · Oct 20, 2025: $411.14. between weekly observations. |
$170.44Oct 14, 2024 | $409.60Oct 14, 2025 | +140.3% | 20.0% |
Brilliant Stars ↗Recorded weeksCatalog release: Feb 25, 2022. Start: Jul 15, 2024: $180.45. recorded week. End: Jul 14, 2025: $405.70 · Jul 21, 2025: $408.58. between weekly observations. |
$180.45Jul 15, 2024 | $406.21Jul 15, 2025 | +125.1% | 20.0% |
Chilling Reign ↗Recorded weeksCatalog release: Jun 18, 2021. Start: Nov 6, 2023: $146.32. recorded week. End: Nov 4, 2024: $229.27 · Nov 11, 2024: $231.47. between weekly observations. |
$146.32Nov 6, 2023 | $229.66Nov 5, 2024 | +57.0% | 20.0% |
Evolving Skies ↗Recorded weeksCatalog release: Aug 27, 2021. Start: Jan 15, 2024: $473.81. recorded week. End: Jan 13, 2025: $1,351.33 · Jan 20, 2025: $1,366.48. between weekly observations. |
$473.81Jan 15, 2024 | $1,354.02Jan 14, 2025 | +185.8% | 20.0% |
Fusion Strike ↗Recorded weeksCatalog release: Nov 12, 2021. Start: Apr 1, 2024: $230.70. recorded week. End: Mar 31, 2025: $475.08 · Apr 7, 2025: $476.80. between weekly observations. |
$230.70Apr 1, 2024 | $475.39Apr 1, 2025 | +106.1% | 20.0% |
$336.43 × 2.2284 = $749.72. After 15% selling costs: +89.4% net ROI.
We average each set’s percentage change over this interval, then apply that average to today’s price. Each physical set has equal influence; variants are averaged within their set first. Unusually large gains or losses can move this simple average substantially.
Source: TCGplayer weekly market-price history. Ages use catalog release dates, which may be set launch dates. Between-week prices are log-interpolated; open “Recorded weeks” to inspect the observations. Prices are rounded for display. Comparison periods may overlap and share market conditions. Historical returns do not guarantee this product’s outcome.
Historical comparisons for other supported horizons
What supports this estimate?
5 previous sets · 36-pack Booster Box · ages 28.6–34.6 months.
4 of 5 sets rose over this interval; 1 fell. These are the complete historical paths used by this forecast.
| Historical set | At 28.6 months | At 34.6 months | Gross return | Share of average |
|---|---|---|---|---|
Astral Radiance ↗Recorded weeksCatalog release: May 27, 2022. Start: Oct 14, 2024: $170.44. recorded week. End: Apr 14, 2025: $267.23 · Apr 21, 2025: $265.50. between weekly observations. |
$170.44Oct 14, 2024 | $267.08Apr 14, 2025 | +56.7% | 20.0% |
Brilliant Stars ↗Recorded weeksCatalog release: Feb 25, 2022. Start: Jul 15, 2024: $180.45. recorded week. End: Jan 13, 2025: $289.87 · Jan 20, 2025: $291.61. between weekly observations. |
$180.45Jul 15, 2024 | $290.02Jan 13, 2025 | +60.7% | 20.0% |
Chilling Reign ↗Recorded weeksCatalog release: Jun 18, 2021. Start: Nov 6, 2023: $146.32. recorded week. End: May 6, 2024: $217.78 · May 13, 2024: $214.99. between weekly observations. |
$146.32Nov 6, 2023 | $217.53May 6, 2024 | +48.7% | 20.0% |
Evolving Skies ↗Recorded weeksCatalog release: Aug 27, 2021. Start: Jan 15, 2024: $473.81. recorded week. End: Jul 15, 2024: $646.11 · Jul 22, 2024: $660.99. between weekly observations. |
$473.81Jan 15, 2024 | $647.42Jul 15, 2024 | +36.6% | 20.0% |
Fusion Strike ↗Recorded weeksCatalog release: Nov 12, 2021. Start: Apr 1, 2024: $230.70. recorded week. End: Sep 30, 2024: $210.37 · Oct 7, 2024: $212.45. between weekly observations. |
$230.70Apr 1, 2024 | $210.55Sep 30, 2024 | -8.7% | 20.0% |
$336.43 × 1.3880 = $466.96. After 15% selling costs: +18.0% net ROI.
We average each set’s percentage change over this interval, then apply that average to today’s price. Each physical set has equal influence; variants are averaged within their set first. Unusually large gains or losses can move this simple average substantially.
Source: TCGplayer weekly market-price history. Ages use catalog release dates, which may be set launch dates. Between-week prices are log-interpolated; open “Recorded weeks” to inspect the observations. Prices are rounded for display. Comparison periods may overlap and share market conditions. Historical returns do not guarantee this product’s outcome.
What supports this estimate?
5 previous sets · 36-pack Booster Box · ages 28.6–52.1 months.
5 of 5 sets rose over this interval. These are the complete historical paths used by this forecast.
| Historical set | At 28.6 months | At 52.1 months | Gross return | Share of average |
|---|---|---|---|---|
Astral Radiance ↗Recorded weeksCatalog release: May 27, 2022. Start: Oct 14, 2024: $170.44. recorded week. End: Sep 28, 2026: $409.83 · Oct 5, 2026: $409.40. between weekly observations. |
$170.44Oct 14, 2024 | $409.75Sep 29, 2026 | +140.4% | 20.0% |
Brilliant Stars ↗Recorded weeksCatalog release: Feb 25, 2022. Start: Jul 15, 2024: $180.45. recorded week. End: Jun 29, 2026: $627.35 · Jul 6, 2026: $629.63. between weekly observations. |
$180.45Jul 15, 2024 | $627.77Jun 30, 2026 | +247.9% | 20.0% |
Chilling Reign ↗Recorded weeksCatalog release: Jun 18, 2021. Start: Nov 6, 2023: $146.32. recorded week. End: Oct 20, 2025: $547.71 · Oct 27, 2025: $536.67. between weekly observations. |
$146.32Nov 6, 2023 | $545.67Oct 21, 2025 | +272.9% | 20.0% |
Evolving Skies ↗Recorded weeksCatalog release: Aug 27, 2021. Start: Jan 15, 2024: $473.81. recorded week. End: Dec 29, 2025: $2,204.17 · Jan 5, 2026: $2,283.94. between weekly observations. |
$473.81Jan 15, 2024 | $2,218.56Dec 30, 2025 | +368.2% | 20.0% |
Fusion Strike ↗Recorded weeksCatalog release: Nov 12, 2021. Start: Apr 1, 2024: $230.70. recorded week. End: Mar 16, 2026: $996.88 · Mar 23, 2026: $989.92. between weekly observations. |
$230.70Apr 1, 2024 | $995.60Mar 17, 2026 | +331.6% | 20.0% |
$336.43 × 3.7220 = $1,252.21. After 15% selling costs: +216.4% net ROI.
We average each set’s percentage change over this interval, then apply that average to today’s price. Each physical set has equal influence; variants are averaged within their set first. Unusually large gains or losses can move this simple average substantially.
Source: TCGplayer weekly market-price history. Ages use catalog release dates, which may be set launch dates. Between-week prices are log-interpolated; open “Recorded weeks” to inspect the observations. Prices are rounded for display. Comparison periods may overlap and share market conditions. Historical returns do not guarantee this product’s outcome.
Historical support ends 23.5 months ahead. No extrapolation.
24-month estimate unavailable: insufficient complete historical paths.
36-month estimate unavailable: insufficient complete historical paths.
Only 36-pack Booster Box histories contribute; collections match their specific format. At least five distinct physical sets must have recorded the entire forecast interval from the same lifecycle age. Up to 20 recent eligible sets contribute, with variants sharing a set’s influence. The longest supported cohort stays fixed across the chart. The center is the simple arithmetic average of recorded cumulative percentage returns. Each physical set has equal influence; variants are averaged within their set first. Every displayed return stays within the observed peer minimum and maximum at that horizon. No mature trend, borrowed age, or short-run annualization extends the curve. Historical support ends 23.5 months ahead; later targets are unavailable. Equal-set 10–90% historical ranges include the average and are not calibrated probability intervals.
One set, separate sealed-product markets
Pokémon Center ETBs, standard ETBs, booster bundles, booster boxes, and collection products are never blended. Collections match their specific format. At least five distinct sets must have recorded the complete interval from the selected product's age. The longest supported cohort stays fixed across the chart. The simple arithmetic average of cumulative percentage returns gives each physical set equal influence, with variants averaged within their set first. Estimates stay within observed peer outcomes at every horizon. Unsupported targets are unavailable; no trend extrapolation is used. Historical ranges are not calibrated probability intervals.
Updated through October 12, 2026. These estimates are best-effort model outputs with no warranty and are not financial advice.
Questions about this set
What is the current Twilight Masquerade sealed product value?
Pokémon Center ETB: $185.51; Standard ETB: $107.1; Booster Bundle: $76.47; Booster Box: $336.43. Prices reflect the reference snapshot through October 12, 2026, not a live quote.
What could Twilight Masquerade be worth in 12 months?
Pokémon Center ETB: $443.09 gross target (+103.0% modeled net ROI after selling costs); Standard ETB: $214.22 gross target (+70.0% modeled net ROI after selling costs); Booster Box: $749.72 gross target (+89.4% modeled net ROI after selling costs). These are model estimates, not guaranteed sale prices.
Which Twilight Masquerade products are tracked?
This page currently covers Pokémon Center ETB, Standard ETB, Booster Bundle, Booster Box. Only the exact physical products listed on the page are modeled.
Are different sealed-product formats combined?
No. ETBs, Booster Bundles, Booster Boxes, and Collection products each use an isolated historical sold-price series and comparison cohort.